
 diglloydTools™


Lively Logic for Graphing
The graphs below are from the 4TB OWC Mercury Elite Pro.
I’ve been using Microsoft Excel to make graphs for years; it is rife with bugs and very frustrating to use, but I’ve dealt with it over the years.
Just recently I obtained Lively Logic, which is a dedicated program for making graphs. It’s very basic, but makes very “clean” looking graphs. The user interface is very simple, and once I figured out a few basics, it was quick and easy to make a very clean uncluttered graph. It took me all of five minutes to make a nice clean-looking graph—a testament to far superior ease of use versus Excel. And NO bugs and NO crashes while making the graph.
From what I see, there is a lot of potential in Lively Logic. It supports multiple types of graphs, multiple datasets. There are a few things that I have not figured out and might just be missing:
- How to include a subtitle. (This feature is important, as I want the graph to include the testing details as seen in the Excel graph below).
- How to annotate a portion of the graph.
- How to overlay an image, e.g., to place a product image in a white area of the graph (Excel has no direct way to do this either).
Bob D writes:
Read your article on Lively Logic. Looks promising. I used to do lots of graphing of data during my career in biomedical research. I used Excel to organize the data, but never liked it for plotting or serious data analysis.
The old Mac classic graphing program was Cricket Graph (don't think it exists any more). Later, I used Kaleidagraph which was more advanced (and probably much more capable than Lively Logic). Free trial available (www.synergy.com).
Also used JMP for statistical analysis and graphing (SAS Institute) and Origin (Windows only) for plotting, but these are somewhat more expensive. Then there is Spotfire which I loved for exploratory data analysis, but probably overkill for your needs at this point (I used it with tens of thousands of data records, with multiple data types for each record -- great tool for that).
Graphed by Lively Logic
This graph is from Lively Logic.
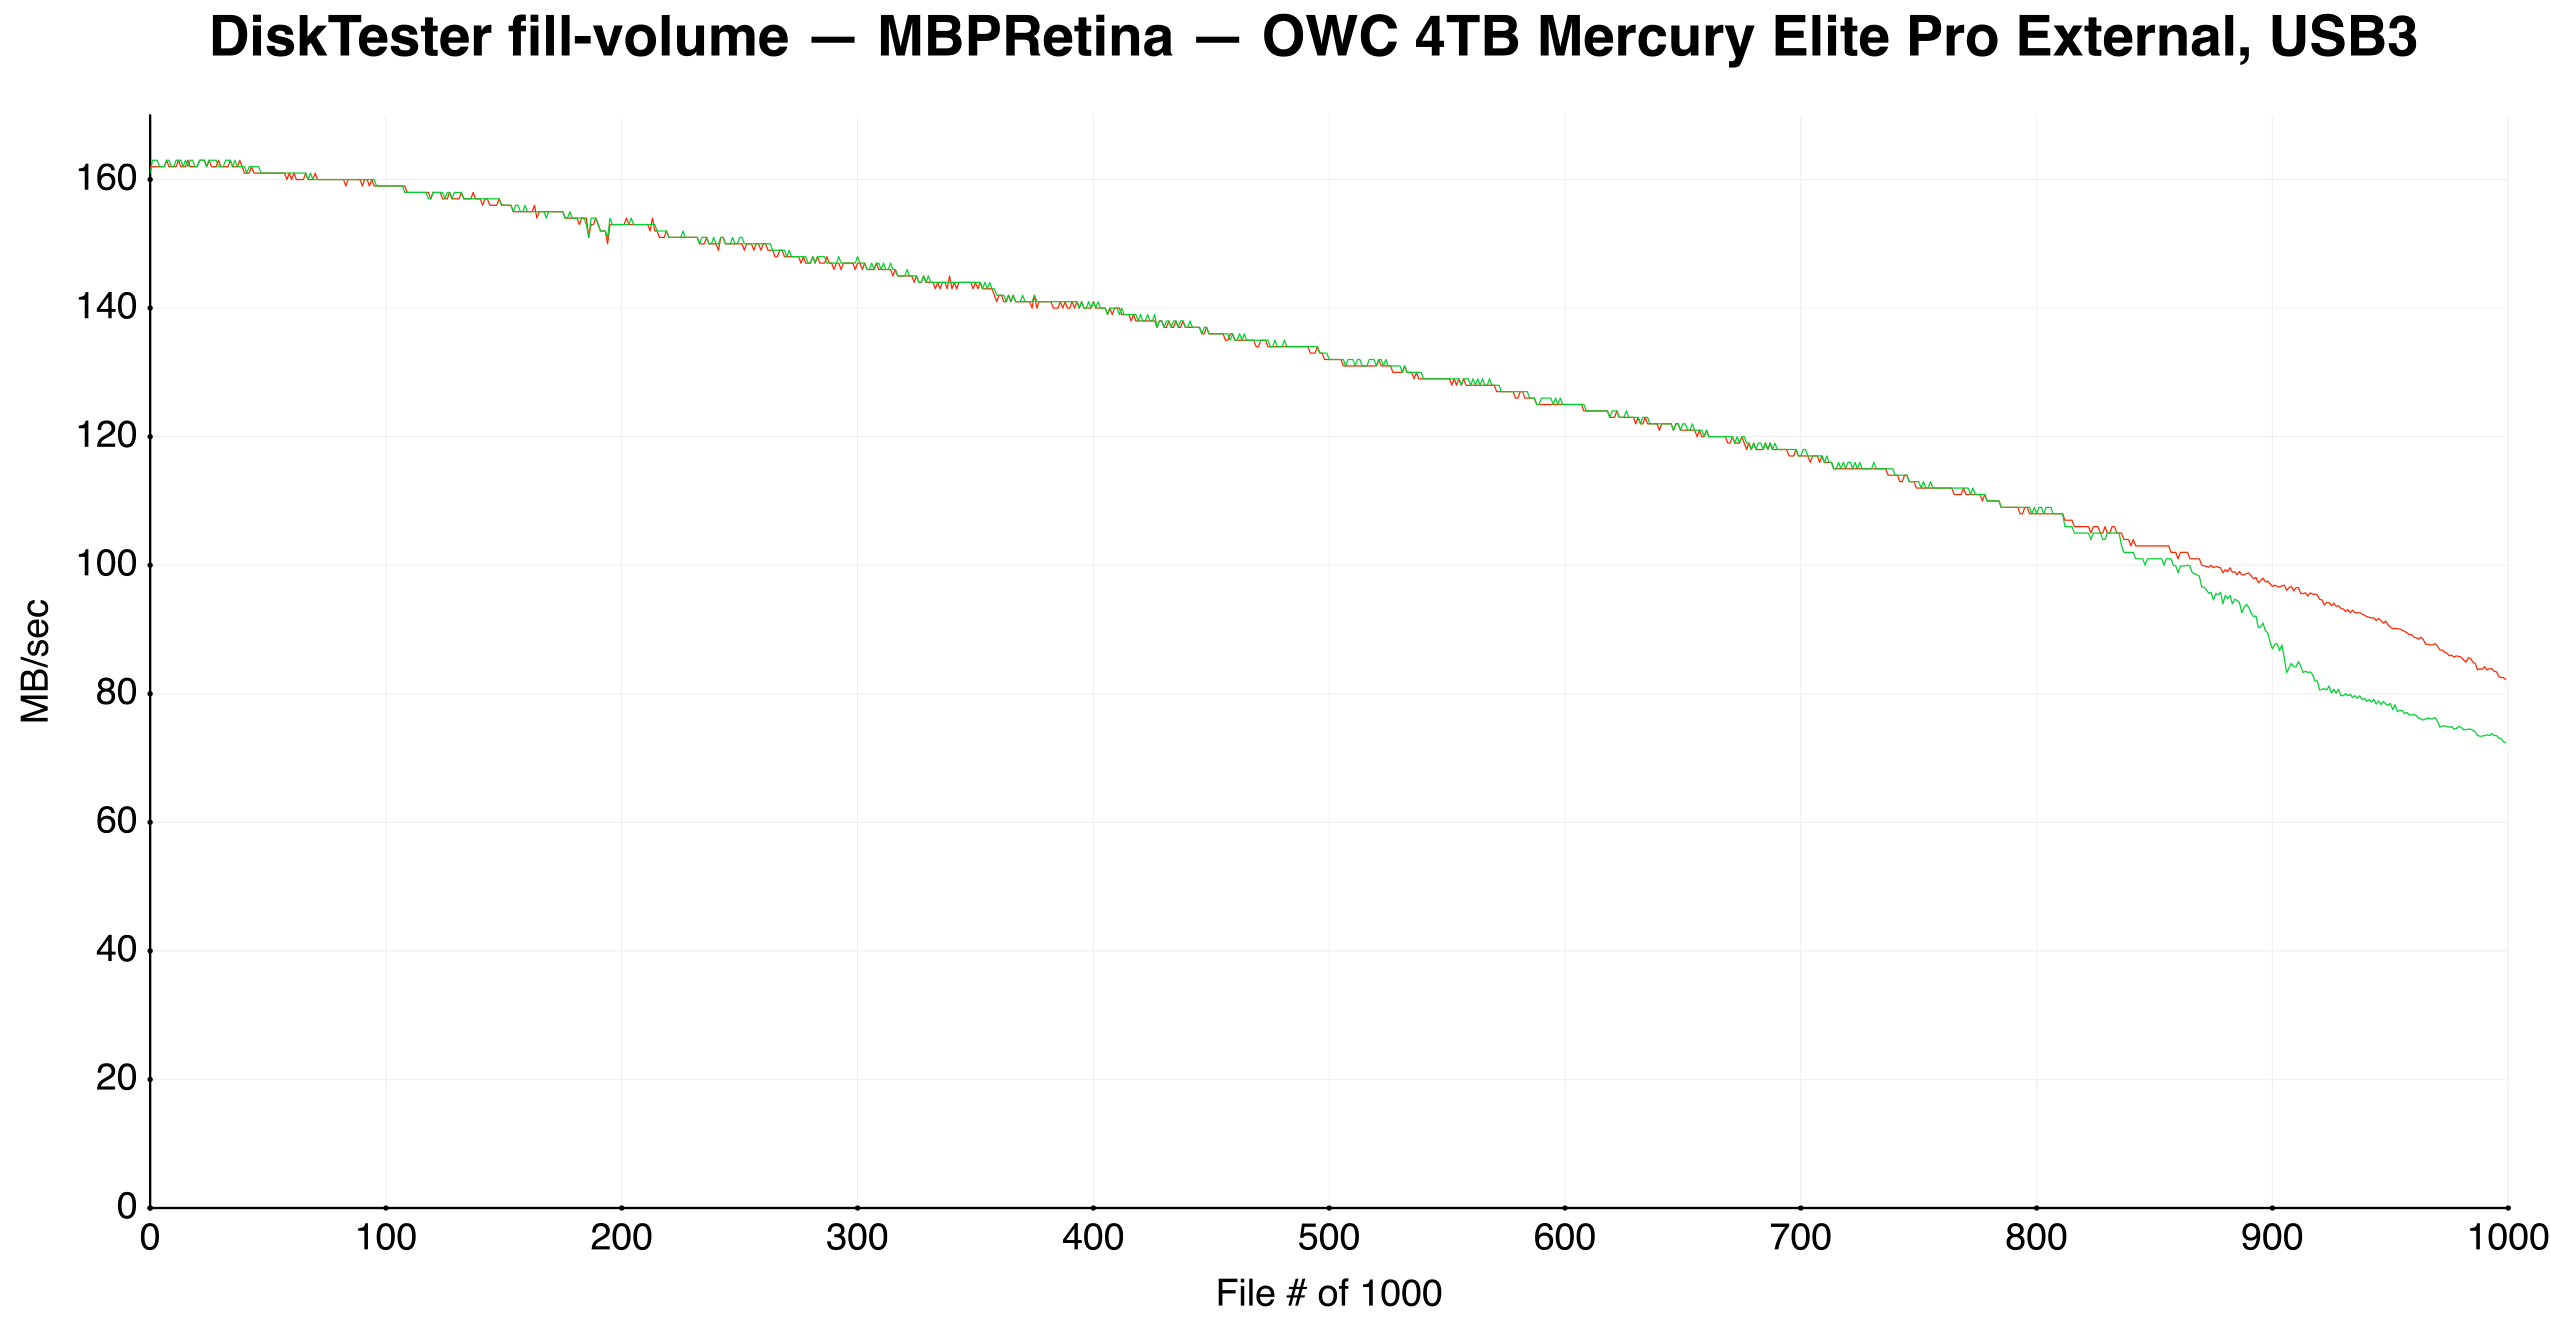
OWC Mercury Elite Pro with Hitachi 4TB 7K4000 hard drive, USB 3, MacBook Pro Retina
Graphed by Excel
This graph is from Microsoft Excel.
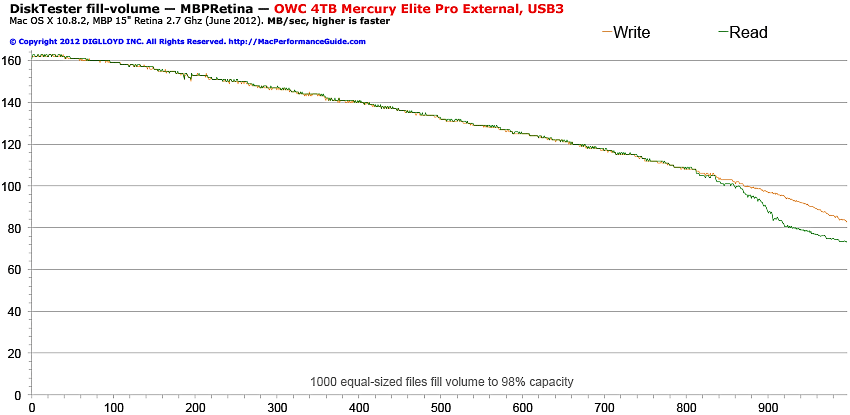
OWC Mercury Elite Pro with Hitachi 4TB 7K4000 hard drive, USB 3, MacBook Pro Retina
